
Πληροφορίες Αποτελεσμάτων
Γράφημα Ηλικιών
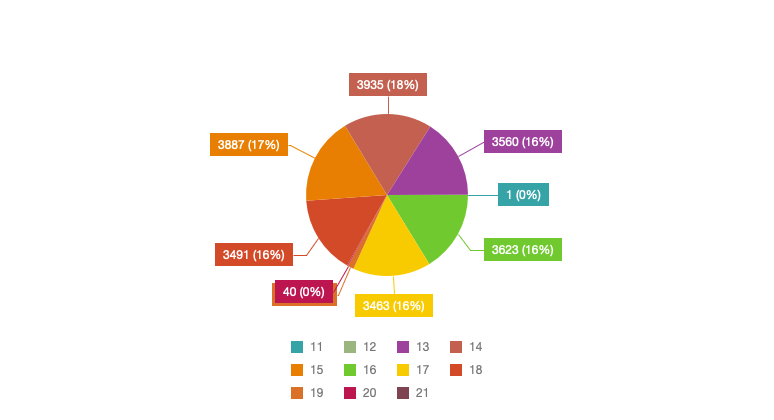
Η γραφική παράσταση είναι ένα κυκλικό διάγραμμα και απεικονίζει την κατανομή των αποτελεσμάτων του τεστ CYFIT ανά ηλικία. Χωρίζεται κατά ηλικία και συνοδεύεται από τον αριθμό των συμμετεχόντων καθώς και το ποσοστό επί του συνόλου.
Ξεκινώντας από την ηλικία των 11 υπάρχει μόνο 1 συμμετοχή και αντιστοιχεί στο 0%. ενώ η ηλικία των 13 κυμαίνεται στο 16% με 3560 συμμετοχές. Με ποσοστό στο 16% βρίσκονται και οι ηλικιακές κατηγορίες των 16, 17 και 18 ετών αντίστοιχα με τις συμμετοχές να κυμαίνονται γύρω απο 3.463 με 3.623 καταγραφές. Ακολουθεί η ηλικία 15 ετών με ποσοστό 17% και 3.887 καταγραφές. Η ηλικία 21 ετών εμφανίζει το υψηλότερο ποσοστό 18% με 3.935 αποτελέσματα, γεγονός που δείχνει μεγαλύτερη συμμετοχή στη συγκεκριμένη ηλικία.
Συνολικά, το διάγραμμα δείχνει ότι η πλειονότητα των αποτελεσμάτων του CYFIT προέρχεται από εφήβους και νεαρούς ενήλικες.
Γράφημα Επαρχιών - Φύλου
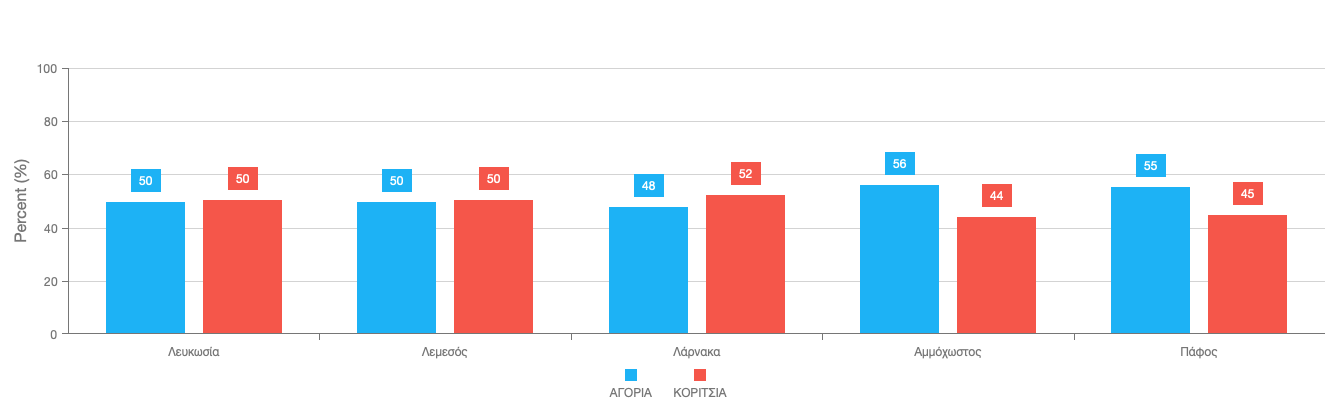
Η γραφική παράσταση είναι διάγραμμα στήλων και παρουσιάζει τα ποσοστά % αγοριών και κοριτσιών που συμμετείχαν στο CYFIT ανά επαρχία της Κύπρου. Στον οριζόντιο άξονα απεικονίζονται οι επαρχίες Λευκωσία, Λεμεσός, Λάρνακα, Αμμόχωστος και Πάφος, ενώ στον κατακόρυφο άξονα τα ποσοστά συμμετοχής. Στα 2 διαφορετικά γραφήματα τα αγόρια απεικονίζονται με μπλε χρώμα και τα κορίτσια με κόκκινο.
Στη Λευκωσία και τη Λεμεσό παρατηρείται ίση κατανομή μεταξύ αγοριών και κοριτσιών, με ποσοστό 50% για κάθε φύλο. Στη Λάρνακα, τα κορίτσια παρουσιάζουν υψηλότερο ποσοστό 52% σε σχέση με τα αγόρια 48%. Αντίθετα, στην Αμμόχωστο και την Πάφο καταγράφεται μεγαλύτερη συμμετοχή αγοριών. Συγκεκριμένα, στην Αμμόχωστο τα αγόρια αποτελούν το 56% και τα κορίτσια το 44%, ενώ στην Πάφο το ποσοστά είναι 55% για τα αγόρια και 45% για τα κορίτσια.
Συνολικά, το διάγραμμα δείχνει ότι στις περισσότερες επαρχίες η διαφορά μεταξύ των αγορίων και κοριτσίων είναι σχετικά ελάχιστη.